Code that Explains Itself
Debugging is a critical skill for programmers, and one that’s difficult to teach and support. Students also struggle to understand how example code works, or even their own code when it isn’t behaving. In both cases, students must learn the critical skill of connecting code to its effects on output.
My Explainable Code prototype explores how to address those problems, with ideas inspired in part by Bret Victor’s Learnable Programming.
Explainable Code
The basic premise behind Explainable Code is that students should be able to ask any of line of code, “What did this line do, when I ran my code?”
I built a prototype to explore what that would look like for code that involves drawing the the block-based Snap! programming environment.
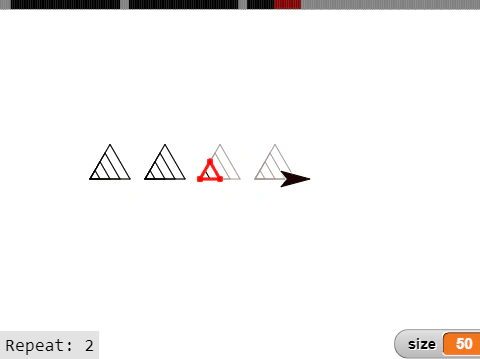
- Hovering over any block shows where the Sprite was at the time on the screen.
- Hovering over a motion block shows how the Sprite moved, and whether the pen was down (solid vs dashed lines).
- Hovering over a loop shows all Sprite movement in each iteration of the loop, allowing students to distinguish the role of inner and outer loops.
- Hovering over a variable-related block shows how the variable changed each time that block executed.
- A timeline bar at the top shows where in the code trace these actions occurred.
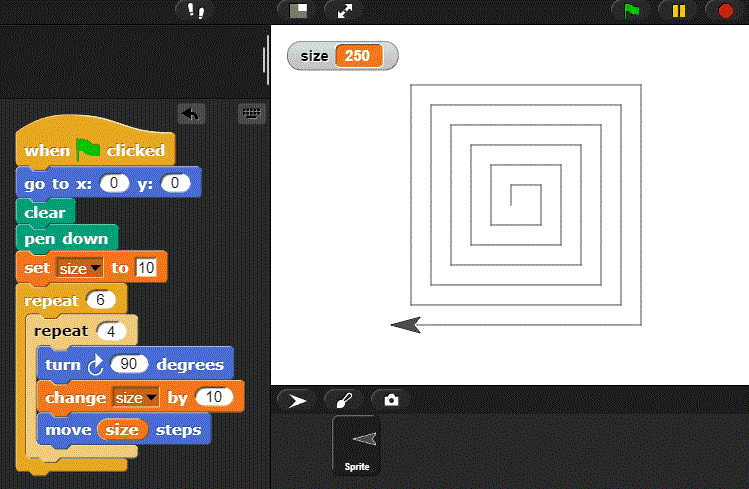
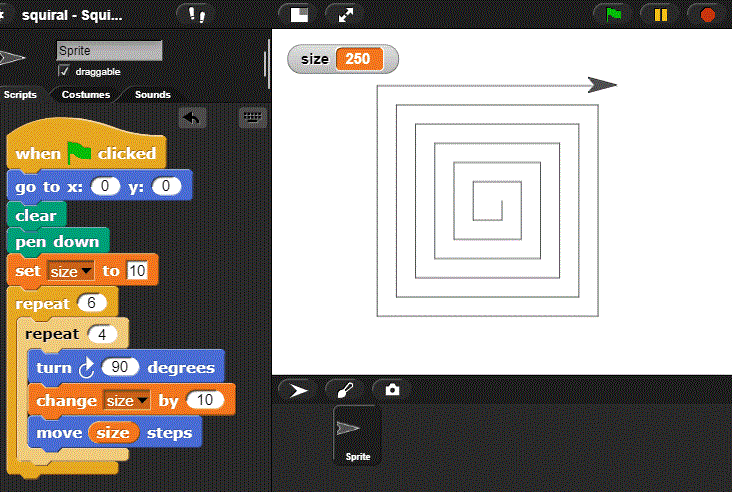
As code gets increasingly complex, such as with triple-nested loops (which happens surprisingly often with novice-written code!), these explanations become more important.
Under the Hood
If you try the demo, you’ll see that the explainable code here isn’t a canned example. You can modify the code and see how the explanation changes.
How does it work? Under the hood, the IDE is recording the full code trace of the user’s program. In other words, every time Snap’s interpreter runs a line of code, the code’s parameters and outcomes are logged, along with the line of code that triggered the action. When we want to explain what a line of code does, we can use those logs to visualize the line’s effect.